Upload date
All time
Last hour
Today
This week
This month
This year
Type
All
Video
Channel
Playlist
Movie
Duration
Short (< 4 minutes)
Medium (4-20 minutes)
Long (> 20 minutes)
Sort by
Relevance
Rating
View count
Features
HD
Subtitles/CC
Creative Commons
3D
Live
4K
360°
VR180
HDR
89 results
We have prepared a video tutorial about Matplotlib, which is a plotting library for the Python programming language and ...
657 views
4 years ago
In this video course, learn about Python Matplotlib and its concepts. Matplotlib is an open-source plotting library. Create interactive ...
37,743 views
2 years ago
Learn Data Analysis with Python in this comprehensive tutorial for beginners, with exercises included! NOTE: Check description ...
4,024,622 views
5 years ago
A tutorial illustrating how to generate random samples from various distributions, how to plot the samples in a histogram and how ...
1,145 views
In this lesson, we discuss the matplotlib Python library which can be used to make figures like this. This isn't the only Python tool, ...
139 views
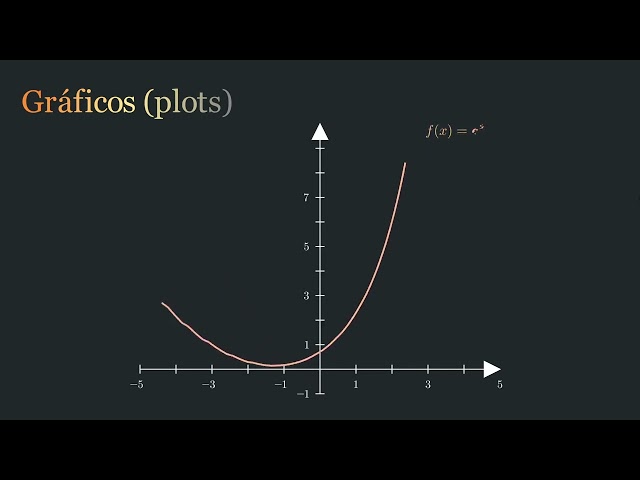
Pyplot, Plot, Sine function.
514 views
[हिन्दी] In this video course, learn about Python Matplotlib and its concepts in Hindi. Matplotlib is an open-source plotting ...
20,400 views
Use of Matplotlib to plot 2d graphics.
2,901 views
Welcome to the "Quantum Bits" mini video series, created for the Qiskit Fall Fest 2024 and the Global Quantum Literacy Event.
28 views
1 year ago
Master Data Analysis with Python and Get Job-Ready: https://techvidvan.com/courses/python-data-analysis-course-hindi/?campaign ...
6,697 views
Learn how to effectively control bar colors and legend entries in Matplotlib using the color and label parameters of the bar function ...
241 views
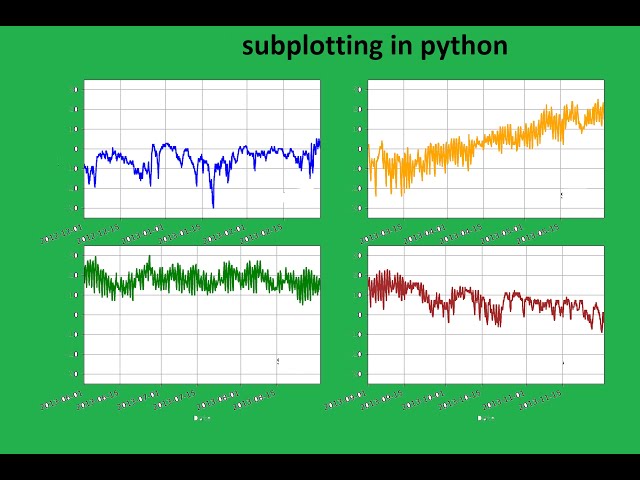
When you first time plot a graph in Python Matplotlib it plots only one graph in the figure. But if you want to draw multiple plots, you ...
376 views
3 years ago
Python project for data analysis- exploratory data analysis | data analysis project for beginners. ⭐Download data file ...
1,036,299 views
python #subplotting #python #pyplot #matplot #short #library @freecodecamp @CodeWithHarry #xii #xiicomputerscience #cbse ...
42 views
Python Data Visualization Masterclass | Matplotlib & Seaborn Full Tutorial Learn how to visualize data using Matplotlib and ...
265 views
10 months ago
This video will go over times series data plotted with Python matplotlib. I will explain line by line ...
7,240 views
Intellipaat Python training course: https://intellipaat.com/python-certification-training-online/ Read complete Python tutorial here: ...
102,098 views
Streamed 6 years ago
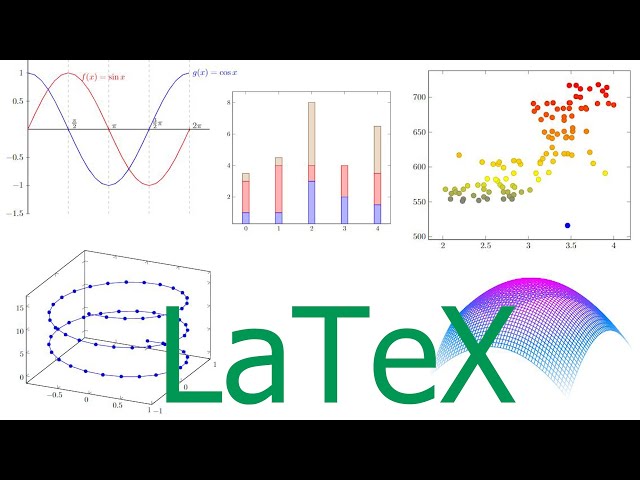
Get started with LaTeX using Overleaf: ▻ https://www.overleaf.com/?utm_source=yt&utm_medium=link&utm_campaign=im22tb.
565,680 views
BIDS Data Science Lecture Series | September 4, 2015 | 1:00-2:30 p.m. | 190 Doe Library, UC Berkeley Speaker: Nathaniel Smith, ...
1,941 views
Streamed 10 years ago
Pythia is one of the most widely used general-purpose Monte Carlo event generators in HEP. It has included a python interface to ...
885 views
Data Visualization using Python.
2,616 views
6 years ago
Do you want to build web apps for your data science project? But do not have any frontend development experience? In this video ...
344 views
python計算複利與list, Matplotlib pyplot科學繪圖[python計算循環複利]https://youtu.be/VPakfmTZ4Jc?si=Rfy8zeCIZvHQK4Oh ...
208 views
In this video tutorial, you will learn how to implement Decision Tree Classification algorithm on Dataset with missing values.
Description: In this tutorial, you'll learn how to draw the Tigray regional flag programmatically using Python, ...
215 views
7 months ago


![Python Matplotlib | Introduction to Python Matplotlib | What is Matplotlib [Hindi]](/api/proxy/image?url=https%3A%2F%2Fi.ytimg.com%2Fvi%2F41poxAYCFhU%2Fsddefault.jpg)