Upload date
All time
Last hour
Today
This week
This month
This year
Type
All
Video
Channel
Playlist
Movie
Duration
Short (< 4 minutes)
Medium (4-20 minutes)
Long (> 20 minutes)
Sort by
Relevance
Rating
View count
Features
HD
Subtitles/CC
Creative Commons
3D
Live
4K
360°
VR180
HDR
72 results
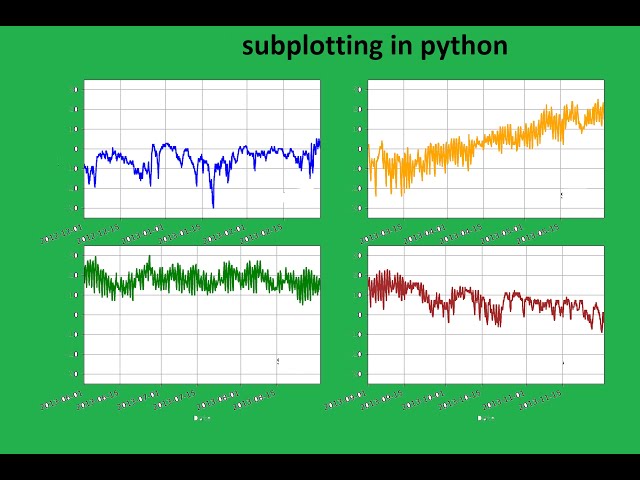
When you first time plot a graph in Python Matplotlib it plots only one graph in the figure. But if you want to draw multiple plots, you ...
375 views
3 years ago
How To Create Subplots using Matplotlib | How To Create Subplots using Python In this Matplotlib subplots tutorial, you'll master ...
46 views
2 years ago
MIT 6.100L Introduction to CS and Programming using Python, Fall 2022 Instructor: Ana Bell View the complete course: ...
24,330 views
1 year ago
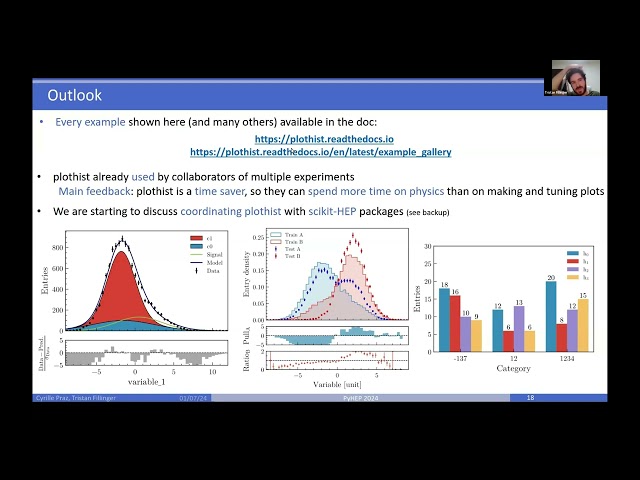
Based on the Matplotlib for HEP workshop developed by HSF Training, we will present a short introduction to matplotlib and ...
61 views
Plothist is a Python package that provides easy-to-use functions for visualizing and comparing histograms generated with ...
102 views
IDRE Workshop from April 16, 2021 Materials available here: https://github.com/benjum/idre-spring21-python-data-viz-1.
1,026 views
4 years ago
The subplots and again, over here, talked about it here. This is over here. So again we have access, right? So with Subplot in the ...
44 views
Streamed 7 months ago
A tutorial illustrating how to generate random samples from various distributions, how to plot the samples in a histogram and how ...
1,140 views
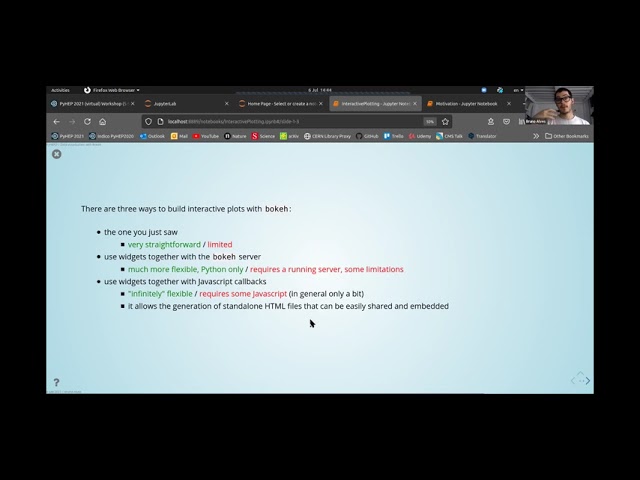
We discuss and justify the application of Python's Bokeh library to non-interactive and interactive visualization. A comparison ...
115 views
... over here to my notebook and i am going to import matplotlib dot pi plot as as plt and then i say plt.subplots and um and in some ...
396 views
5 years ago
How to do Univariate, Bivariate & Multivariate Analysis using Scatter Plot with Seaborn in Python Source Code and Notes are ...
393 views
We have prepared a video tutorial about Matplotlib, which is a plotting library for the Python programming language and ...
657 views
In this video, Learn Data Visualization using Python: What is Matplotlib in Python with an example.
56 views
Learn how to effectively control bar colors and legend entries in Matplotlib using the color and label parameters of the bar function ...
230 views
Topics Covered: ⏱ Time Topic 00:00 Intro 00:02 Dark Mode Graphs with Matplotlib Easily 02:10 Cyber Punk Sytle Graphs with ...
103 views
1 month ago
A bar chart race, also known as a bar chart animation or a bar chart race animation, is a data visualization technique that shows ...
6,145 views
python #subplotting #python #pyplot #matplot #short #library @freecodecamp @CodeWithHarry #xii #xiicomputerscience #cbse ...
42 views
For Source Code And Quizzes: Drive Link: ...
6 views
9 months ago
This video dives deep into the basics of numpy, pandas, matplotlib - these are the 3 main libraries that are used in ALMOST ALL ...
2,839 views
In this video, Dataquest's Director of Curriculum, Anna Strahl, will guide you through how to clean and analyze real survey data ...
1,171 views
5 months ago