Upload date
All time
Last hour
Today
This week
This month
This year
Type
All
Video
Channel
Playlist
Movie
Duration
Short (< 4 minutes)
Medium (4-20 minutes)
Long (> 20 minutes)
Sort by
Relevance
Rating
View count
Features
HD
Subtitles/CC
Creative Commons
3D
Live
4K
360°
VR180
HDR
161 results
A behind-the-scenes look at how I animate videos. Code for all the videos: https://github.com/3b1b/videos Manim: ...
2,782,531 views
1 year ago
To try everything Brilliant has to offer—free—for a full 30 days, visit https://brilliant.org/ArtemKirsanov/ The first 200 of you will get ...
898,927 views
2 years ago
A bar chart race, also known as a bar chart animation or a bar chart race animation, is a data visualization technique that shows ...
6,184 views
In the field of astronomy and astrophysics, data cubes are fundamental tools for analyzing three-dimensional data sets that ...
257 views
Most of us have heard the saying, "A picture is worth a thousand words," but a movie builds context and a story, especially when ...
1,289 views
3 years ago
Let's try to convince a bunch of particles to behave (at least somewhat) like water. Written in C# and HLSL, and running inside the ...
2,459,247 views
A data cube in astronomy is a three-dimensional array of data, where two of the dimensions correspond to spatial information (like ...
398 views
Welcome back to another tutorial video! In this video I am going to be showing you how to make a planet simulation using Python!
534,616 views
Speaker: Reshama Shaikh Plotly is a versatile, open-source python graphing library which lets us make interactive graphs.
106 views
4 years ago
We have prepared a video tutorial about Matplotlib, which is a plotting library for the Python programming language and ...
657 views
Want help automating Blender with Python? Go here: https://cgpython.com/skool/78 In this video, we will create a script that ...
9,285 views
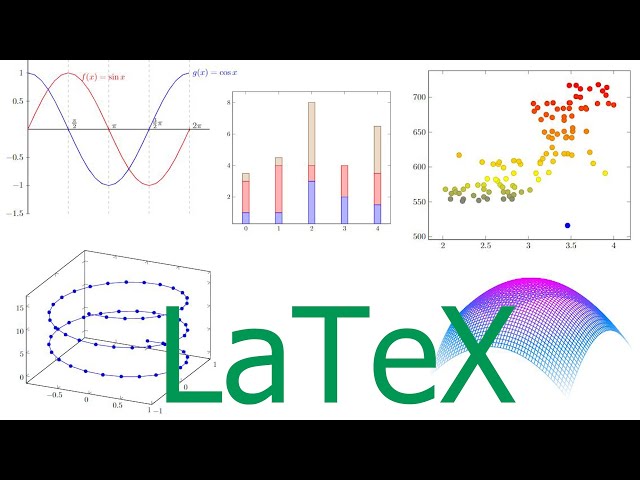
Get started with LaTeX using Overleaf: ▻ https://www.overleaf.com/?utm_source=yt&utm_medium=link&utm_campaign=im22tb.
565,605 views
Python Notebooks are great for communicating data analysis & research but how do you port these data visualizations between ...
2,336 views
5 years ago
Wavelet transform is an invaluable tool in signal processing, which has applications in a variety of fields - from hydrodynamics to ...
751,121 views
"This builds on what we learned in the past two days about animating graphics. Here we create two balls, but use Ball objects, ...
972 views
7 years ago
Thanks to Mailgun for sponsoring this video! Try Mailgun today by using my link https://mailgun.com/techwithtim Recently this ...
38,608 views
Struggling with Python in Blender? Go here: https://cgpython.com/skool/89 In this video, we will create a script that generates an ...
9,433 views
You guys can help me out over at Patreon, and that will help me keep my gear updated, and help me keep this quality content ...
144,195 views
Welcome to the ivirazka channel, your one-stop destination for mastering Python for data analysis. Whether you're a beginner ...
12 views
In this action-packed Julia Programming Language coding tutorial, you'll learn how to create animations using the Luxor.jl ...
2,733 views
In this presentation, we'll take a look at what it takes to generate fundamental chart types using SAS (ODS Graphics), R (ggplot2) ...
2,700 views
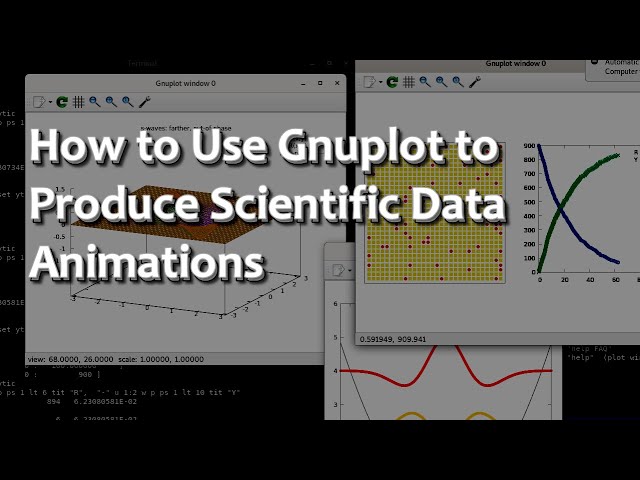
How to Use Gnuplot to Produce Scientific Data Animations ----------------------------- Are you looking for a simple way to illustrate ...
6,712 views
Pyplot, Plot, Sine function.
514 views
BIDS Data Science Lecture Series | September 4, 2015 | 1:00-2:30 p.m. | 190 Doe Library, UC Berkeley Speaker: Nathaniel Smith, ...
1,941 views
Streamed 10 years ago
10xfast Adobe XD : XD Data Charts & auto-animate Task-based creative repetition. 16 XD art boards in Adobe XD to create data ...
527 views


![[04x08] Luxor Animation + Turtle Graphics! | Luxor.jl, FFmpeg, Julia & VS Code [Julia Desktop Apps]](/api/proxy/image?url=https%3A%2F%2Fi.ytimg.com%2Fvi%2FWJS19qh0BuU%2Fsddefault.jpg)