Upload date
All time
Last hour
Today
This week
This month
This year
Type
All
Video
Channel
Playlist
Movie
Duration
Short (< 4 minutes)
Medium (4-20 minutes)
Long (> 20 minutes)
Sort by
Relevance
Rating
View count
Features
HD
Subtitles/CC
Creative Commons
3D
Live
4K
360°
VR180
HDR
429 results
Acoustics by Prof. Nachiketa Tiwari,Department of Mechanical Engineering,IIT Kanpur.For more details on NPTEL visit ...
5,131 views
10 years ago
3,560 views
Problem 2 on Bode Plot Video Lecture of Chapter Frequency Response Analysis in Control Systems for EXTC, Instrumentation, ...
159,358 views
7 years ago
... look at bode plot for a system having transfer function gs = say 1 by s okay so again we can get the frequency response function ...
2,785 views
8 years ago
To access the translated content: 1. The translated content of this course is available in regional languages. For details please ...
3,698 views
3,592 views
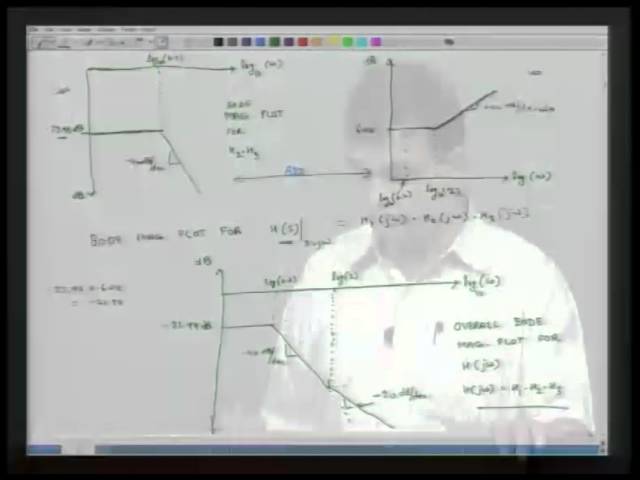
... what we are well, then we will see how to put everything together and plot the bode diagram for any given transfer function, ok.
19,682 views
6 years ago
So, consequently the frequency response is characterized by a P of j omega which is called as a sinusoidal transfer function, right.
31,093 views
3,268 views
... several factors ah several individual transfer functions and i have multiplied them up then the overall transfer functions bode plot ...
1,114 views
9 years ago
S-Domain Analysis, Transfer Function ,Poles and Zeros-II.
1,664 views
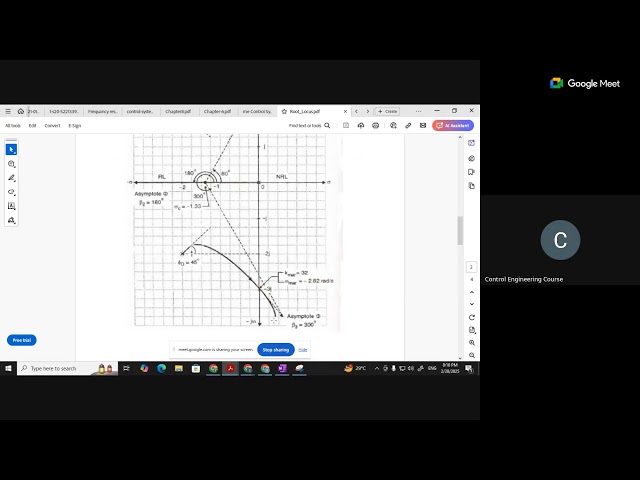
So in order to plot the root locus, when we have this type of poles present in our transfer function, we have to find out the angle of ...
62 views
Streamed 10 months ago
So suppose we have a transfer function with a single pole so you have H of S is equal to a upon S plus a, so then the bode plot is ...
15,075 views
So, that is a question I leave you with or if I give you bode plot of a transfer function by looking at it, can you get the relative degree ...
16,128 views
... start by developing a bode plot for magnitude for a simple zero so bode plot for a simple zero so in this case the transfer function ...
911 views
So, the same transfer function plot its Bode diagram. Please do this as homework, ok, please do this and compare, right. I think we ...
14,953 views
A Bode plot /ˈboʊdi/ is a graph of the transfer function of a linear, time-invariant system versus frequency, plotted with a ...
403 views
11 years ago
In this video, the issue of stability in the Feedback Amplifier is discussed. During the video, the condition for the stability in the ...
8,904 views
1 year ago
Lecture Series on Control Engineering by Prof. Ramkrishna Pasumarthy, Department of Electrical Engineering, IIT Madras.
13,766 views
Learn more about the TI Precision Labs - Op Amp Evaluation Module used in the hands-on lab modules ...
17,672 views