Upload date
All time
Last hour
Today
This week
This month
This year
Type
All
Video
Channel
Playlist
Movie
Duration
Short (< 4 minutes)
Medium (4-20 minutes)
Long (> 20 minutes)
Sort by
Relevance
Rating
View count
Features
HD
Subtitles/CC
Creative Commons
3D
Live
4K
360°
VR180
HDR
2,000 results
In this video course, learn about Python Matplotlib and its concepts. Matplotlib is an open-source plotting library. Create interactive ...
36,625 views
1 year ago
IDRE Workshop from April 16, 2021 Materials available here: https://github.com/benjum/idre-spring21-python-data-viz-1.
1,026 views
4 years ago
Learn Data Analysis with Python in this comprehensive tutorial for beginners, with exercises included! NOTE: Check description ...
3,988,829 views
5 years ago
To try everything Brilliant has to offer—free—for a full 30 days, visit https://brilliant.org/ArtemKirsanov/ The first 200 of you will get ...
892,269 views
2 years ago
In this video about exploratory data analysis with pandas and python, Kaggle grandmaster Rob Mulla will teach you the basics of ...
644,229 views
3 years ago
This Python data science course will take you from knowing nothing about Python to coding and analyzing data with Python using ...
4,598,797 views
Welcome to this next part of our Python programming page. Um, this time around, we want to look at the last package, which is a ...
9 views
Click this link https://sponsr.is/bootdev_TechWithTim and use my code TECHWITHTIM to get 25% off your first payment for ...
625,117 views
11 months ago
Learn the basics of Python, Numpy, Pandas, Data Visualization, and Exploratory Data Analysis in this course for beginners.
3,136,927 views
We have prepared a video tutorial about Matplotlib, which is a plotting library for the Python programming language and ...
657 views
[हिन्दी] In this video course, learn about Python Matplotlib and its concepts in Hindi. Matplotlib is an open-source plotting ...
19,626 views
Jupyter notebooks and python notebooks are an important tool for data science. If you want to learn about them this is the ultimate ...
561,716 views
Visit https://postmarkapp.com/lp/tech-with-tim and use coupon code TECHWITHTIM to get 20% off any plan for three months.
124,193 views
4 months ago
Generating figures is part of the scientific process. This should not be manual, but ideally they should be automatically generated ...
134 views
Master Data Analysis with Python and Get Job-Ready: ...
6,371 views
In this video, Dataquest's Director of Curriculum, Anna Strahl, will guide you through how to clean and analyze real survey data ...
1,141 views
5 months ago
Can you learn Data Science - even if you don't know Python - in just an hour? YES. In this complete tutorial, you'll learn the basics ...
95,759 views
In this video, Learn Data Visualization using Python: What is Matplotlib in Python with an example.
56 views
This video dives deep into the basics of numpy, pandas, matplotlib - these are the 3 main libraries that are used in ALMOST ALL ...
2,701 views
Learn Excel in just 2 hours: https://kevinstratvert.thinkific.com In this step-by-step tutorial, learn how you can use Python in ...
505,651 views
A bar chart race, also known as a bar chart animation or a bar chart race animation, is a data visualization technique that shows ...
6,097 views
In this tutorial, we will learn about NumPy arrays in great detail! NumPy is one of the most popular Python libraries and just as it ...
160,894 views
A behind-the-scenes look at how I animate videos. Code for all the videos: https://github.com/3b1b/videos Manim: ...
2,651,817 views
For real-time updates on events, connections & resources, join our community on WhatsApp: https://jvn.io/wTBMmV0 Learn to ...
39,102 views
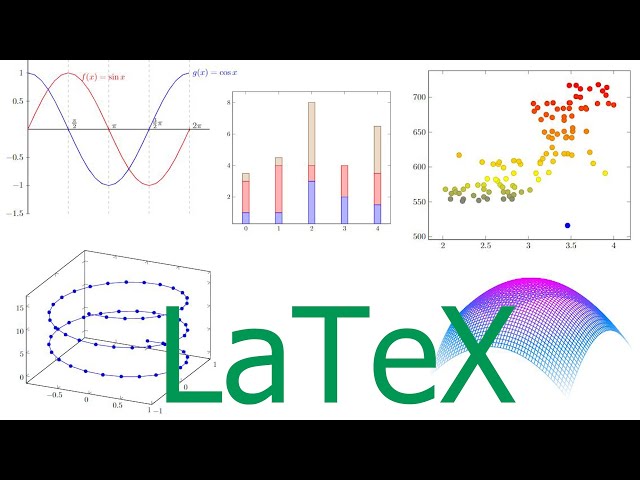
Get started with LaTeX using Overleaf: ▻ https://www.overleaf.com/?utm_source=yt&utm_medium=link&utm_campaign=im22tb.
560,070 views


![Python Matplotlib | Introduction to Python Matplotlib | What is Matplotlib [Hindi]](/api/proxy/image?url=https%3A%2F%2Fi.ytimg.com%2Fvi%2F41poxAYCFhU%2Fsddefault.jpg)