ViewTube

ViewTube
Sign inSign upSubscriptions
Filters

Upload date

Type

Duration

Sort by

Features

Reset

344 results

Aalto Scientific Computing
2.3 Visualizaiton - Python for Scientific Computing 2023

Generating figures is part of the scientific process. This should not be manual, but ideally they should be automatically generated ...

46:58
2.3 Visualizaiton - Python for Scientific Computing 2023

139 views

2 years ago

BioniChaos
Real-Time Biomedical Data Visualization: Creating Lissajous Curves with Python and Flask

Welcome to another live development session on BioniChaos! In this video, I dive into the process of developing BioCurveViz, ...

50:36
Real-Time Biomedical Data Visualization: Creating Lissajous Curves with Python and Flask

62 views

1 year ago

BetaNYC
Visualizing MTA Performance Data with Python

NYC Open Data Week 2023 - Mar 16 2023 The Metropolitan Transportation Authority (MTA) runs the largest public transportation ...

50:15
Visualizing MTA Performance Data with Python

239 views

2 years ago

BetaNYC
Learn how to explore NYC Open Data with Python

NYC Open Data Week 2023 - Mar 14 2023 Curious about open data but not sure how to get started? Join Hunter College's ...

44:22
Learn how to explore NYC Open Data with Python

266 views

2 years ago

New Mexico EPSCoR
Python Fundamentals with Data Analysis and Visualization

Python is a high-level programming language that is leveraged in a wide range of disciplines and fields. This webinar training ...

47:21
Python Fundamentals with Data Analysis and Visualization

140 views

4 years ago

BioniChaos
Exploring Open Source Brain MRI Data with Python | Building a 3D MRI Viewer Using Flask!

Welcome to this live session, where I dive deep into the world of brain MRI data and explore how to build a 3D MRI viewer using ...

27:30
Exploring Open Source Brain MRI Data with Python | Building a 3D MRI Viewer Using Flask!

656 views

1 year ago

Visualizing the Future
Preparing and Understanding Data | Data Visualization 101

Presented by Angela Zoss. This video is part of a series of lectures recorded to teach about basic data visualization concepts.

25:33
Preparing and Understanding Data | Data Visualization 101

59 views

4 years ago

BioniChaos
Decoding Inner Speech BCI: From Neural Data to Python Visualization

Decoding Inner Speech BCI: From Neural Data to Python Visualization In this video, we explore the fascinating intersection of ...

42:52
Decoding Inner Speech BCI: From Neural Data to Python Visualization

31 views

2 months ago

NEON Science
Data Skills Webinar: Intro to NEON API in Python

This 1.5-hour webinar will provide an introduction to the structure and use of APIs in general, and the NEON API in particular.

50:07
Data Skills Webinar: Intro to NEON API in Python

245 views

2 years ago

BioniChaos
Visualizing Neuroscience Data: MATLAB to JSON & Python Web Dashboard

Python Automation: Visualizing Neuroscience Data & Handling Large JSON Files In this video on biomedical data science and ...

28:39
Visualizing Neuroscience Data: MATLAB to JSON & Python Web Dashboard

11 views

2 months ago

BocoupLLC
The Role of Visualization in Exploratory Data Analysis - Hadley Wickham

And unless you can do that, you cannot create a good visualization. And so I have the� this is my sort of mental model of data ...

31:35
The Role of Visualization in Exploratory Data Analysis - Hadley Wickham

14,936 views

8 years ago

BocoupLLC
Visualizing data with deck.gl - Nicolas Belmonte

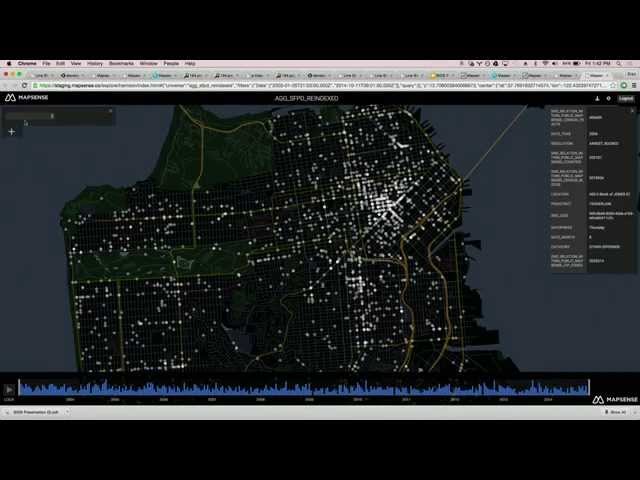
GL, used for data visualization and abstract visualization use cases. And we decided to open source end of last year. So I'm going ...

23:38
Visualizing data with deck.gl - Nicolas Belmonte

8,197 views

8 years ago

Aaron J Newman
14  - Visualization with Seaborn

Seaborn is a great plotting package for Data Science in Python. It allows you to easily generate common kinds of plots that help ...

49:33
14 - Visualization with Seaborn

797 views

4 years ago

NPTEL IIT Bombay
Tutorial 04 Part 01: Plotting In 1 D Using Python

Week 4: Tutorial 04 Part 01: Plotting In 1 D Using Python.

28:22
Tutorial 04 Part 01: Plotting In 1 D Using Python

1,205 views

4 years ago

BioniChaos
Building an AI Sensor Dashboard: Python Model Training & Visualization

In this video, we explore the intersection of biomedical data science and web development as we continue building the ...

22:19
Building an AI Sensor Dashboard: Python Model Training & Visualization

10 views

2 months ago

BioniChaos
CRISPR Simulation Lab: Python, BioPython & D3.js for Genomic Editing Visualization

In this video, I dive into the development of a CRISPR Simulation Lab using Python, BioPython, and D3.js to visualize and edit ...

26:54
CRISPR Simulation Lab: Python, BioPython & D3.js for Genomic Editing Visualization

357 views

1 year ago

Alex The Analyst
Automating Crypto Website API Pull Using Python | Data Analyst Project

Take my Full Python Course Here: https://bit.ly/48O581R In this project we look at automating this API pull as well as cleaning up ...

51:14
Automating Crypto Website API Pull Using Python | Data Analyst Project

94,031 views

3 years ago

Matthew Curinga (mxc)
Sequential, divergent, and categorical colormaps in python

This videos is for week 4 of Intro to Programming at Adelphi University 2024. We look at plotting US Census data for large cities in ...

1:09:39
Sequential, divergent, and categorical colormaps in python

207 views

1 year ago

freeCodeCamp.org
Learn Data Science Tutorial - Full Course for Beginners

Learn Data Science is this full tutorial course for absolute beginners. Data science is considered the "sexiest job of the 21st ...

5:52:09
Learn Data Science Tutorial - Full Course for Beginners

4,348,243 views

6 years ago

BioniChaos
VibeCoding a Kaggle Data Visualizer with AI: IMU & ToF Sensors

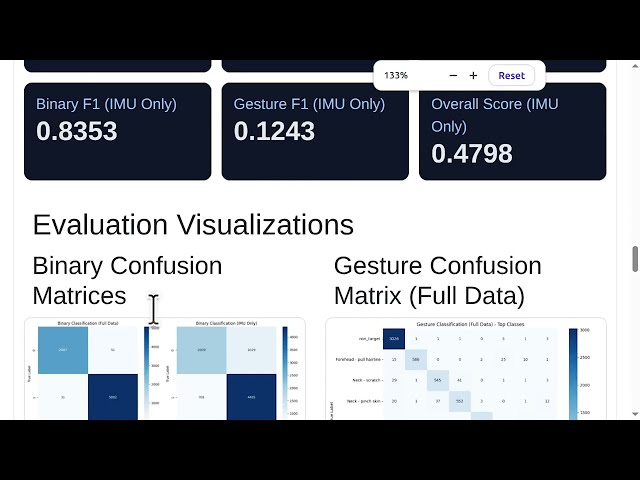
In this video, we explore biomedical data science by tackling the CMI Detect Behavior with Sensor Data challenge from Kaggle.

55:47
VibeCoding a Kaggle Data Visualizer with AI: IMU & ToF Sensors

13 views

2 months ago

BioniChaos
Exploring Event-Related Potentials (ERPs): Live Coding, EEG Analysis & Dynamic Visualizations

In this video, I dive into the fascinating world of Event-Related Potentials (ERPs) using dynamic Python simulations and ...

30:10
Exploring Event-Related Potentials (ERPs): Live Coding, EEG Analysis & Dynamic Visualizations

71 views

1 year ago

The Journal of Open Source Software
Visualize Hypergraphs with Open Source – Brenda Praggastis on HyperNetX | JOSSCast Ep.18

18: Brenda Praggastis joins Arfon and Abby to discuss HyperNetX, a Python package for modeling complex network data as ...

31:22
Visualize Hypergraphs with Open Source – Brenda Praggastis on HyperNetX | JOSSCast Ep.18

295 views

1 year ago

Code4Lib
Code4Lib 2024 — Day 3 Morning

... 01:47:51 Three(ish) Tips for Better Data Visualization — Angela Zoss 01:54:48 Learning from Poggio Civitate: Data Verification ...

3:08:01
Code4Lib 2024 — Day 3 Morning

822 views

Streamed 1 year ago

Berkeley Institute for Data Science (BIDS)
How We Designed Matplotlib's New Default Colormap (and You Can Too)

BIDS Data Science Lecture Series | September 4, 2015 | 1:00-2:30 p.m. | 190 Doe Library, UC Berkeley Speaker: Nathaniel Smith, ...

1:01:33
How We Designed Matplotlib's New Default Colormap (and You Can Too)

1,944 views

Streamed 10 years ago

Berkeley Institute for Data Science (BIDS)
Big Data Mapping: Modern Tools for Geographic Analysis and Visualization

BIDS Data Science Lecture Series | February 13, 2015 | 1:00-2:30 p.m. | 190 Doe Library, UC Berkeley Speaker: Erez Cohen, ...

1:01:54
Big Data Mapping: Modern Tools for Geographic Analysis and Visualization

13,365 views

Streamed 10 years ago