Upload date
All time
Last hour
Today
This week
This month
This year
Type
All
Video
Channel
Playlist
Movie
Duration
Short (< 4 minutes)
Medium (4-20 minutes)
Long (> 20 minutes)
Sort by
Relevance
Rating
View count
Features
HD
Subtitles/CC
Creative Commons
3D
Live
4K
360°
VR180
HDR
1,550 results
Chrome DevTools: a suite of tools to debug and profile the performance of your site. They're bundled with every copy of Chrome, ...
41 views
7 years ago
... determine performance and accessibility issues via an auto-generated report, debug JavaScript apps with powerful new async ...
83,580 views
8 years ago
We've all had some JavaScript errors in our codes and we sometimes have a hard time debugging it. In this video, I'll show you ...
180 views
1 year ago
Presented at Open Source in Finance Forum 2022 - NYC Presented by Bethany Griggs - Red Hat Title: Debugging Node.js ...
55 views
3 years ago
Presented at jQuery Conference San Diego February 12-13, 2014 http://events.jquery.org/2014/san-diego/ February 12, 2014 at ...
3,649 views
11 years ago
Chrome provides an amazing assortment of completely underused tools to debug and optimize your JavaScript. Most JavaScript ...
106 views
6 years ago
This talk will help developers write performant JavaScript, use new language constructs (ES2015+, async/await, etc.), and learn ...
73,995 views
Jake and Surma tackle one of the hardest types of debugging on the web: Memory leaks. Some links mentioned: Squoosh ...
51,294 views
4 years ago
If you'd like to dive deeper into your dev tools, I have a two-hour bonus lesson as part of my course CSS Demystified that dives ...
30,782 views
Here we spend ONE HOUR talking about debugging! Sigh. If it is too much for you, you are welcome to take a break and have a ...
213 views
by Amit Zur At: FOSDEM 2018 Room: UA2.118 (Henriot) Scheduled start: 2018-02-03 13:00:00+01.
33 views
Learn the state of the art in debugging using Chrome dev tools with Paul Irish - all you need to know to expand your toolbox.
143,485 views
9 years ago
Remotely debugging and testing your JavaScript code for multiple devices at once, is a pain. There are tools which exist already ...
345 views
10 years ago
42 views
Can you debug some through lines of code of JavaScript using this engine 262 okay uh so yeah I mean the thing is that you know ...
124 views
Streamed 5 years ago
Learn about Chrome Developer Tools. We'll have a detail look at what different options exist for developer to troubleshoot their ...
532 views
Struggling to understand what your js-libp2p or Helia node is doing under the hood? UPDATE: js-libp2p DevTools are now ...
205 views
5 months ago
Profiling and debugging are hard activities in general, since they are related with the dynamic behaviour of applications.
216 views
Sorry I messed up the audio record so you'll only hear my voice, I'll have this working correctly with the next one. First time using ...
597 views
Streamed 9 years ago
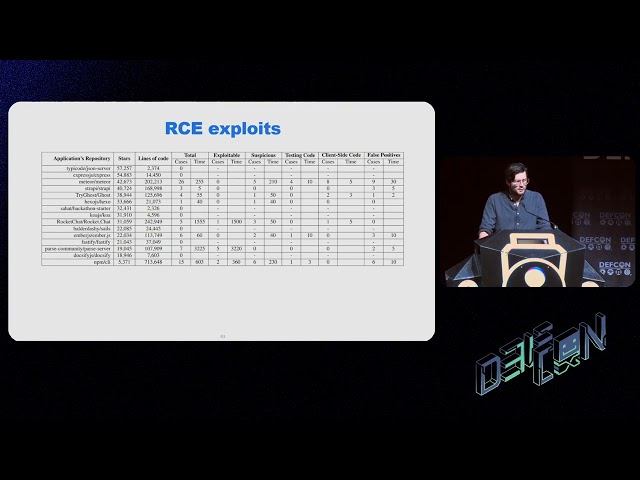
Many have heard about Prototype Pollution vulnerabilities in JavaScript applications. This kind of vulnerability allows an attacker ...
3,969 views
2 years ago