Upload date
All time
Last hour
Today
This week
This month
This year
Type
All
Video
Channel
Playlist
Movie
Duration
Short (< 4 minutes)
Medium (4-20 minutes)
Long (> 20 minutes)
Sort by
Relevance
Rating
View count
Features
HD
Subtitles/CC
Creative Commons
3D
Live
4K
360°
VR180
HDR
57 results
Help for Homework 1 (spring 2016). You'll find a couple of ideas for quick and easy data collection from Wikipedia and Facebook, ...
101 views
9 years ago
An example of a data exploration exercise. Note that each set of data is unique and different - there is no one single "right way" to ...
192 views
5 years ago
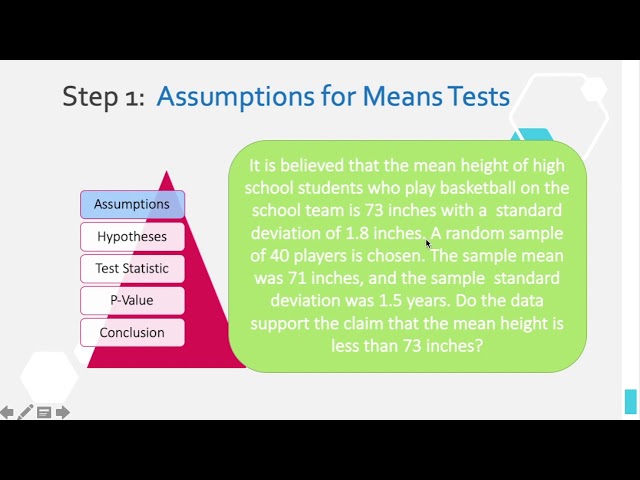
z-Test and t-Test for one population mean This video references the openstax Introductory Statistics textbook and the Knewton ...
79 views
... should be everything it is everything at least that relates to this homework uh thanks for watching and I hope this was helpful.
21 views
11 years ago
Statistics 243 Homework Help using Excel.
98 views
1 year ago
This is an example of testing a claim about a population proportion using the TI-84 graphing calculator. We find the test statistic, ...
87 views
3 years ago
This goes over the topic of finding the confidence interval for a population proportion. This examples is #6 on Chapter 8-8.3 ...
174 views
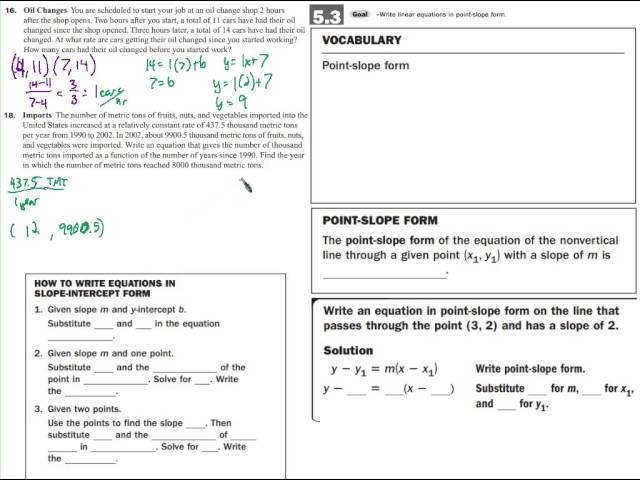
This video introduces the least squares regression line, and shows how to find the equation of the regression line--the best fit line ...
168 views
Learn all about histograms with Mr. Ahmed Magdy! In this video, we'll cover lessons 2 and 3 from Unit 6 of the 6th-grade math ...
265 views
This is an example of testing whether there is a positive linear correlation between two variables. This video shows how to graph a ...
102 views
We talk a lot about building well-crafted software. But what about a well-crafted career in software? Who is making sure you're on ...
5,857 views
10 years ago
Based on the previous philosophical discussion about probability let's attempt to define this concept more rigorously. By now we ...
219 views
Course Systematic Reviews and Meta-Analyses of Psychological Interventions of the Vrije Universiteit (VU) Amsterdam ...
22,058 views
Here is look at a variety of examples of good and bad graphs.
127 views
Selected Problems from Ansel's Pharmaceutical Calculations.
245 views
Streamed 7 years ago
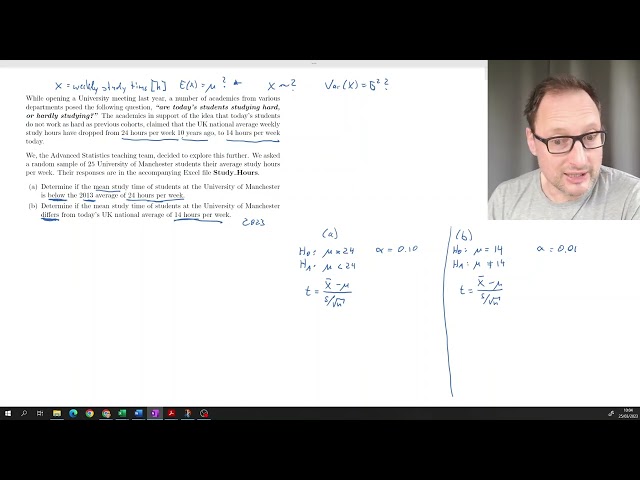
In this clip we perform two hypothesis tests for a population mean. We put particular focus on how to determine the distribution of ...
826 views
2 years ago
Mr. Mitchell discusses the recent addition of Moby Math to his teaching tool chest and the implications of individualizing math to ...
6,617 views
13 years ago
In this video, Jason S. Todd demonstrates how to create an Assignment Submission Folder and a Discussion Forum & Topic in ...
50 views
In this sixth-grade math tutorial, teacher Ahmed Magdy provides a comprehensive explanation of lesson 5 from unit 6: applications ...
971 views
Patreon: https://www.patreon.com/chycho ▶️ SubscribeStar: https://www.subscribestar.com/chycho ▶️ Twitch Channel: ...
3,010 views


![COVID-19 Coronavirus Data Analysis: Intro (4:02), Graphs & Data (10:00) [Video Glitches 7:30-12:50]](/api/proxy/image?url=https%3A%2F%2Fi.ytimg.com%2Fvi%2FuQFNlp-PPN8%2Fsddefault.jpg)