Upload date
All time
Last hour
Today
This week
This month
This year
Type
All
Video
Channel
Playlist
Movie
Duration
Short (< 4 minutes)
Medium (4-20 minutes)
Long (> 20 minutes)
Sort by
Relevance
Rating
View count
Features
HD
Subtitles/CC
Creative Commons
3D
Live
4K
360°
VR180
HDR
6,337 results
Video Description: Master Data Visualization with Python: From Beginner to Advanced! In this comprehensive Data ...
37,292 views
1 year ago
"The Python Data Visualization Landscape in 2020 EuroPython 2020 - Talk - 2020-07-24 - Parrot Data Science Online By Bence ...
928 views
5 years ago
Try CodeCrafters for free using my referral link: https://app.codecrafters.io/join?via=trentpark8800 In this walkthrough, we dive into ...
89,747 views
In our research, hospitals, businesses and work, we accumulate new data every second. Indeed, data is everywhere.
1,013 views
Streamed 6 years ago
Try CodeCrafters for free using my referral link: https://app.codecrafters.io/join?via=trentpark8800 Welcome to this ...
14,140 views
Take my Full Python Course Here: https://www.analystbuilder.com/courses/pandas-for-data-analysis In this series we will be ...
233,304 views
2 years ago
... https://coursera.pxf.io/AoYOdR Tableau Data Visualization - https://coursera.pxf.io/MXYqaN Udemy Courses: Python for Data ...
120,008 views
539,223 views
Kyran Dale - Data-visualisation with Python and Javascript: crafting a data-viz toolchain for the web [EuroPython 2015] [21 July ...
3,064 views
10 years ago
ai #python #codanics #artificialintelligence #urdu This complete course is being uploaded here: ...
6,474 views
Streamed 2 years ago
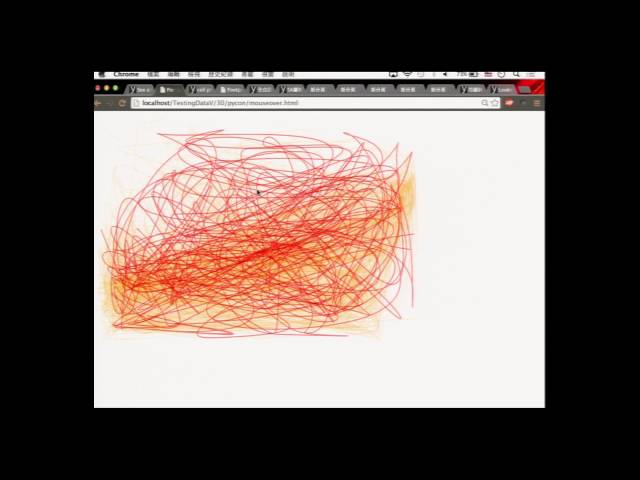
http://blog.muyueh.com/real-time-visualization-with-python-and-d3-js/ Pyhton has great power in scrapping and analyzing data, ...
22,325 views
11 years ago
Data Visualization with Python. Learn Matplotlib, Numpy, line plot, bar plot, scatter plot, histogram, data set, and distribution ...
38 views
In this tutorial, you'll learn about how to Data Visualization by using Plotly. Plotly is the best tool in Python for Data Visualization.
156 views
3 years ago
Debugging Your Code with Data Visualization [EuroPython 2018 - Talk - 2018-07-26 - Fintry [PyData]] [Edinburgh, UK] By James ...
866 views
7 years ago
ai #python #codanics #artificialintelligence #urdu We will cover this: https://codanics.com/data-visualization-in-data-science/ This ...
6,644 views
This tutorial teaches how to use the Plotly library in Python to perform Data visualizations. Recording and Tutorial was made by ...
701 views
If you have some computer science knowledge, but never worked with Python before, this is the right place for you. Our speaker ...
1,577 views
Check out all my Full Courses on Analyst Builder: https://www.analystbuilder.com/ 25% Off Analyst Builder Code: BOOTCAMP In ...
1,024,009 views
Stephan Heunis about how to visualize your data interactively and how to deploy a Dash app to let others interact with your data ...
121 views
4 years ago
In this tutorial, you'll learn how to data visualization using Python and master the Python Programming Language! Seaborn ...
59 views


![Ultimate Data Analyst Bootcamp [24 Hours!] for FREE | SQL, Excel, Tableau, Power BI, Python, Azure](/api/proxy/image?url=https%3A%2F%2Fi.ytimg.com%2Fvi%2FwQQR60KtnFY%2Fsddefault.jpg)