Upload date
All time
Last hour
Today
This week
This month
This year
Type
All
Video
Channel
Playlist
Movie
Duration
Short (< 4 minutes)
Medium (4-20 minutes)
Long (> 20 minutes)
Sort by
Relevance
Rating
View count
Features
HD
Subtitles/CC
Creative Commons
3D
Live
4K
360°
VR180
HDR
1,564 results
In this video, we will discuss how to draw the Bode plot from a given transfer function. This is Example 2 in this series where we ...
19,465 views
3 years ago
In this video, we will discuss how to draw the Bode plot from a given transfer function. This is Example 3 in this series where we ...
15,358 views
In this video, we will discuss how to draw the Bode plot from a given transfer function. We will workout step by step how to convert ...
8,119 views
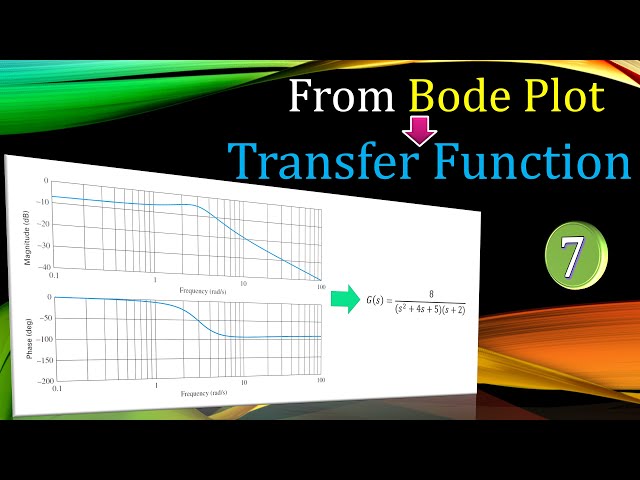
In this video, we will discuss how to determine the transfer function from a Bode plot with a gain peaking. Gain peaking can be due ...
8,936 views
4 years ago
In this video, I have solved an example on how to sketch the bode magnitude and phase plot. The book that I am referring to in this ...
648,926 views
9 years ago
6,724 views
In this video we discuss how to generate a bode plot of a complex transfer function by decomposing it into the individual ...
23,285 views
6 years ago
This lecture explains the sketch of asymptotic Bode diagrams for quadratic factors. In quadratic factors, there may appear a peak ...
3,675 views
In this video I show you how to draw a bode plot of a complex pole.
287 views
7 years ago
How to interpret Bode plots and use them for frequency domain system identification.
4,466 views
8 years ago
Class starts at the 13:30 mark. This lecture introduces the use of straight-line approximation Bode plots. In particular, the ...
194 views
Streamed 5 years ago
Frequency-domain approach for AC circuits, complex impedance, Low-pass and High-Pass filters, Bode plots (transfer functions)
23,947 views
11 years ago
Bode Plots of G_1[s] = (10s)/((s+0.1)(s+10)) & G_2[s] = (5(s+0.1))/(s(s+0.01)(s+100)) Produced by the Electrical and Computer ...
1,167 views
12 years ago
This video will demonstrate how to create the straight line approximation of Bode amplitude and phase plots. It will define the bel ...
2,184 views
10 years ago
Now in order to find the bode plot I'm gonna have to look into the magnitude plots and face plots of individual terms we will start ...
878 views
ME 370 System Dynamics and Controls Spring 2017: finishing the vibrations example by sketching the pole-zero and Bode plots.
144 views
MECE3350 Control Systems: Bode plots with complex poles and zeros Exercise 100: https://youtu.be/tLvQgQBVpBI Exercise 101: ...
3,035 views
5 years ago
Bode Plots, Example, Sketching. This lecture was recorded at Saint Martin's University in the Spring 2018 term as part of the ...
142 views
Bode plots, plots of a frequency response function, are defined and straight-line sketching techniques are described. This lecture ...
388 views
00:00 Start 01:45 Review 13:36 Decibels 29:04 MATLAB 33:30 Bode Plot ex 1 45:30 Bode Plot ex 2.
67 views