Upload date
All time
Last hour
Today
This week
This month
This year
Type
All
Video
Channel
Playlist
Movie
Duration
Short (< 4 minutes)
Medium (4-20 minutes)
Long (> 20 minutes)
Sort by
Relevance
Rating
View count
Features
HD
Subtitles/CC
Creative Commons
3D
Live
4K
360°
VR180
HDR
53 results
Animated 3D Surface Visualization using Python & Matplotlib This video demonstrates a rotating and animated 3D surface ...
0 views
17 hours ago
Python, Ingeniería de Datos, Curso Python, Python Desde Cero, Aprender Python, Instalar Python, VS Code, Visual Studio Code, ...
676 views
12 hours ago
Want to create stunning charts, graphs, and dashboards using Python? In this YouTube Shorts video, you'll discover the top ...
5 hours ago
PYTHON with AI (CORE & ADVANCED) Online Training @ DURGASOFT ...
20 hours ago
Welcome to Day 9 of the Python Programming Bootcamp! In this video, you'll learn how to work with some of the most powerful ...
2 hours ago
In this video, I build and explain my Minor Project titled “Telecom Network Call Drop Analysis using Exploratory Data Analysis ...
15 hours ago
Welcome to AI ML Explainer! We simplify AI, ML, deep learning, and agent-based systems through clear explanations.
6 hours ago
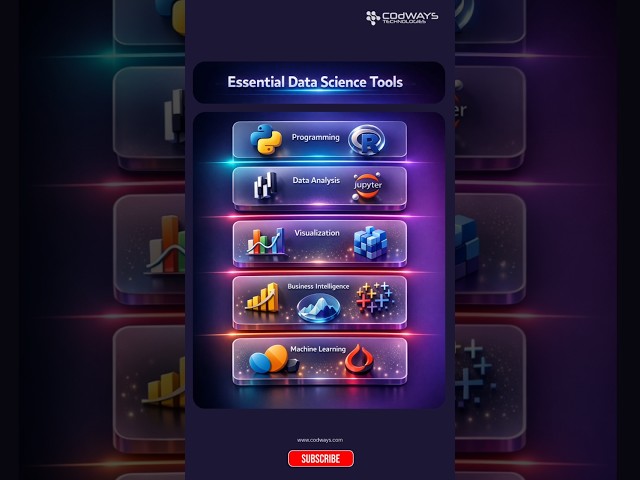
Data Science requires the right tools to analyze data, build models, and deliver insights. In this short video, you'll see the essential ...
157 views
Modules and libraries help you organize code, reuse functionality, and build scalable Python applications. In this video, we ...
14 hours ago
Bubble sort algorithm animation. Ever wondered how computers sort data? This is Bubble Sort visualized! It compares two ...
5 views
1 hour ago
Free Data Analyst KickStarter Pack - https://datacoaching4628.graphy.com/courses/dataanalyst-freecourse Check Data Analytics ...
4 hours ago
In this video, I explain my mini project Online Learning Platform Notification Click Analysis. The project uses Python, Pandas, and ...
14 views
Yahoo Finance Stock Analysis using Python | Real-Time Data Visualization (Tesla & Nvidia) In this video, I will show you how to ...
48 views
... python django, django python, flask python, fastapi python, python requests, python pandas, python numpy, python matplotlib, ...
2 views
18 hours ago
Sudoku is a common number puzzle, that can be seen in newspapers, and online portals. It is a 9 x 9 grid, and the idea is to fill ...
Our Live Trainings Have Officially Started! If you want to master AI Engineering, MERN Stack Development, and JavaScript at an ...
733 views
Streamed 13 hours ago
Chapters: 00:00:28 1. What is Matplotlib? 00:00:50 2. Why Visualize Data? 00:01:19 3. The Pyplot Module 00:01:45 4.
Matplotlib Introduction ULTIMATE Guide (2025): Master Data Visualization in Python from Scratch #matplotlib #datavisualization ...
44 views
Learn how to create a clean and simple Area Chart in Python using Matplotlib and NumPy. In this tutorial, we visualize cumulative ...
Chapters: 00:00:29 1. Preparing Continuous Data 00:00:58 2. The Role of Bins 00:01:20 3. Generating the Histogram (`plt.hist`) ...


![[Python for Beginners]: 37.01. Matplotlib: Introduction](/api/proxy/image?url=https%3A%2F%2Fi.ytimg.com%2Fvi%2FTsp1MBjMN9w%2Fsddefault.jpg)

![[Python for Beginners]: 37.08. Matplotlib: histogram](/api/proxy/image?url=https%3A%2F%2Fi.ytimg.com%2Fvi%2FrDcgT7mCSB4%2Fsddefault.jpg)