ViewTube

ViewTube
Sign inSign upSubscriptions
Filters

Upload date

Type

Duration

Sort by

Features

Reset

2,932 results

code io - Tamil
Matplotlib Full Course in 90 Minutes  | Python for AI DS - part 3 | code io - Tamil

Link to download Anaconda : https://www.anaconda.com/products/navigator Google Colab : https://colab.research.google.com/ ...

1:31:56
Matplotlib Full Course in 90 Minutes | Python for AI DS - part 3 | code io - Tamil

1,491 views

2w ago

Jakubication
How To Install matplotlib in Python 3.14.5

This video shows how to install matplotlib on Python 3.14.5 It will walk you through, step-by-step, how to install matplotlib on ...

2:24
How To Install matplotlib in Python 3.14.5

66 views

3w ago

Learn Computer Science with Prof. Rashi
Visualize Satellite NDVI Data in Python with Rasterio &Matplotlib | Anaconda Setup

GIS Lab Practical 2 is here! In this video, we open a real satellite image (.tif file), read its pixel values, and render it as a ...

10:26
Visualize Satellite NDVI Data in Python with Rasterio &Matplotlib | Anaconda Setup

26 views

3w ago

ALUB, SOPHIA GUADALUPE L.
MATPLOTLIB Instructional Video | Alub, Sophia Guadalupe L.

In this video, I explain: • What Matplotlib is • Creating graphs using plt.plot() • Adding titles and labels Tools Used: • Python ...

9:11
MATPLOTLIB Instructional Video | Alub, Sophia Guadalupe L.

20 views

3w ago

Intellipaat
Data Science Complete Course Free | Data Science Course 2026 | Inellipaat

Enroll for Data Science Course: https://intellipaat.com/data-scientist-course-training/ Book your Free ...

Live
Data Science Complete Course Free | Data Science Course 2026 | Inellipaat

0 views

0

ADHYAYANAM - Mind Mantra
video11 1st plot #python #plot #learning #editor Python Plotting Visualization

Comment on why the x-axis shows values upto 3 only.

9:08
video11 1st plot #python #plot #learning #editor Python Plotting Visualization

2 views

2w ago

The How-To Learning Academy
How to Create Charts with Multiple Y Axes in Matplotlib Python [2026 Guide]

How to Create Charts with Multiple Y Axes in Matplotlib Python [2026 Guide] In today's video we cover: Matplotlib, Python, ...

2:18
How to Create Charts with Multiple Y Axes in Matplotlib Python [2026 Guide]

0 views

22h ago

WishInfinite
Matplotlib Full Course for Beginners  | Complete Python Data Visualization Tutorial | NumPy + Pandas

Learn Matplotlib from scratch in this complete beginner-friendly Python tutorial covering everything from basic plots to professional ...

3:46:38
Matplotlib Full Course for Beginners | Complete Python Data Visualization Tutorial | NumPy + Pandas

70 views

11d ago

Kuro
Matplotlib: Data Visualization with Python - The Grandfather of Python Plotting

Matplotlib is the grandfather of Python data visualization. Created by John D. Hunter in 2002, it powers virtually every data science ...

1:37
Matplotlib: Data Visualization with Python - The Grandfather of Python Plotting

12 views

3w ago

AI Evolutionary
Python Line Plot Tutorial for Beginners | Matplotlib Step by Step Guide

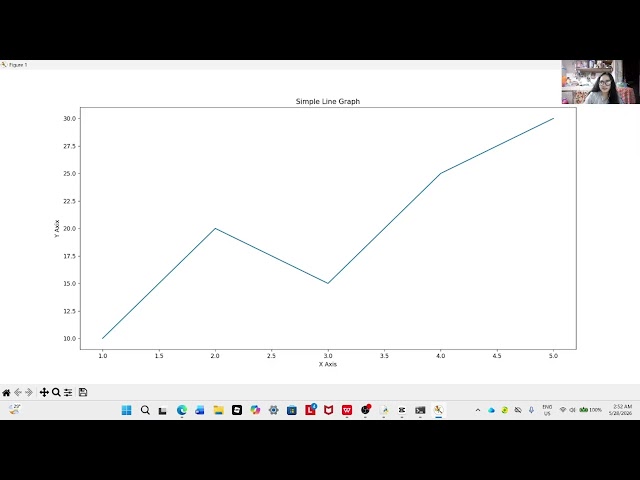
Python Line Plot Tutorial for Beginners | Matplotlib Step by Step Guide In this video, you will learn how to create a simple line chart ...

1:00
Python Line Plot Tutorial for Beginners | Matplotlib Step by Step Guide

16 views

3w ago

Elhaine Daniel
Exploring the Basics of MatPlotLib Library in Python

This video talks about the Matplotlib capabilities, and applying it into a simple, working program that makes a line graph ...

11:09
Exploring the Basics of MatPlotLib Library in Python

3 views

2w ago

MrNiriteach
Matplotlib Masterclass 🔥 | Complete Python Data Visualization Course 🚀 | Beginner to Advanced

Stop watching random Matplotlib tutorials. This Matplotlib Masterclass is a complete roadmap designed to help you master Python ...

1:17:43
Matplotlib Masterclass 🔥 | Complete Python Data Visualization Course 🚀 | Beginner to Advanced

38 views

4w ago

Mathew K Analytics
Master Styling, Annotations & Saving Techniques for Python Data Visualization

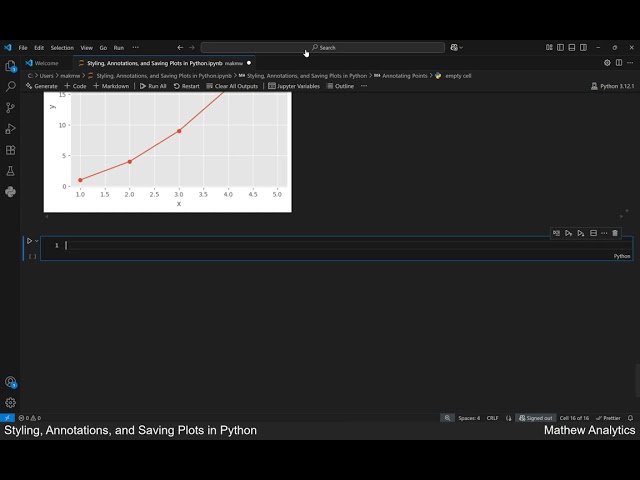
Want to take your Python data visualization skills to the next level? In this video, you'll learn how to style your plots, add impactful ...

12:39
Master Styling, Annotations & Saving Techniques for Python Data Visualization

2 views

13d ago

python_coding
Python 3D Charts with Matplotlib! 📊Turning raw student data into a pro 3D chart.#Python #DataViz
0:43
Python 3D Charts with Matplotlib! 📊Turning raw student data into a pro 3D chart.#Python #DataViz

3 views

2w ago

Nazli Tech School
🎬 MBOA FLIX Lesson 5 (Part 2): Intro to Data Science, JSON Integration & Matplotlib Analytics 📊#ai

Welcome to Lesson 5 (Part 2)! Now that we've mastered backend data analytics, it's time to bring your app to life with stunning, ...

1:01:49
🎬 MBOA FLIX Lesson 5 (Part 2): Intro to Data Science, JSON Integration & Matplotlib Analytics 📊#ai

160 views

9d ago

NARVAEZ, JULIA L.
Matplotlib Tutorial for Beginners: Learn Data Visualization in Python
13:22
Matplotlib Tutorial for Beginners: Learn Data Visualization in Python

4 views

2w ago

LetMeTeach
Matplotlib Data Visualization Python Tutorial | Data Science | LetMeTeach

Mastering data visualization is a core requirement for any engineering student, GATE DA aspirant, or aspiring data scientist.

1:27
Matplotlib Data Visualization Python Tutorial | Data Science | LetMeTeach

11 views

3w ago

The How-To Learning Academy
How to Add Error Bars in Matplotlib Python [2026 Guide]

How to Add Error Bars in Matplotlib Python [2026 Guide] In today's video we cover: Matplotlib, Python, add error bars matplotlib, ...

2:17
How to Add Error Bars in Matplotlib Python [2026 Guide]

0 views

22h ago

MILLARES, MARSHA LAINE V.
Learn Matplotlib in Python | Simple Demo & Overview

Discover how Matplotlib helps create graphs and charts in Python for easier data visualization and analysis. #Python ...

14:23
Learn Matplotlib in Python | Simple Demo & Overview

47 views

2w ago

Zafar Iqbal
Pandas - Lecture 07 - Data Visualization

In this video we explore how data can be visualized using libraries like matplotlib and seaborn. Track 2 - Module 1 - Python ...

26:08
Pandas - Lecture 07 - Data Visualization

1,424 views

3w ago