Upload date
All time
Last hour
Today
This week
This month
This year
Type
All
Video
Channel
Playlist
Movie
Duration
Short (< 4 minutes)
Medium (4-20 minutes)
Long (> 20 minutes)
Sort by
Relevance
Rating
View count
Features
HD
Subtitles/CC
Creative Commons
3D
Live
4K
360°
VR180
HDR
1,166 results
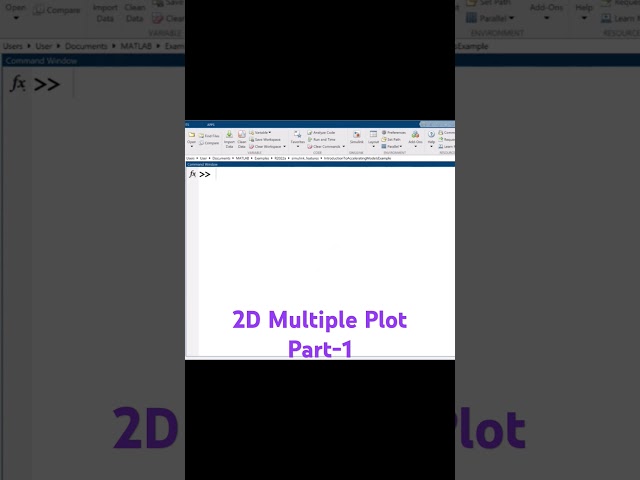
In this MATLAB tutorial, you will learn how to plot multiple 2D graphs using simple plot commands. This method allows you to ...
333 views
9 months ago
... or a researcher this skill is essential for visualizing data effectively in math lab so let's get started by plotting um multiple 2D lines ...
136 views
8 months ago
Engineers and scientists often work with complex, multidimensional data that is difficult to interpret in raw tables. Surface plots in ...
2,061 views
2 months ago
123 views
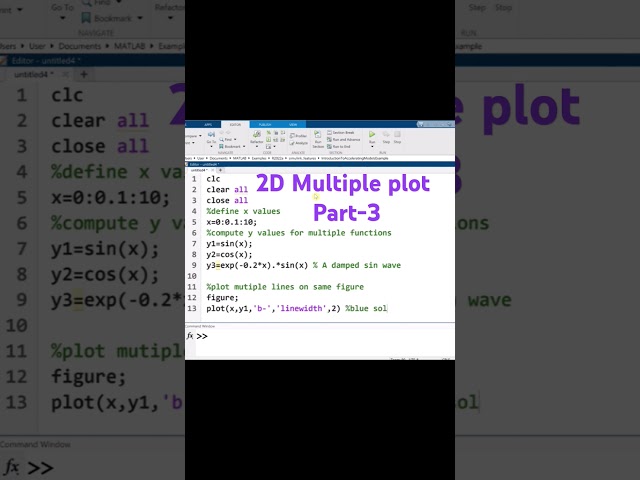
... of X Okay And next I'm going to plot x versus y by 3 And I'm using a color green And the style should be dash dot And I'm setting ...
188 views
This MATLAB script plots a parabolic function of the form . The x-axis represents the input values, while the y-axis shows the ...
27 views
10 months ago
So I am going to write figure that open a new figure window Then I'm going to plot X versus Y1 and color should be blue with style ...
103 views
This MATLAB script generates a 2D plot of the functions and on the same axis. Different line styles and colors are used to ...
0 views
Okay so next I am going to add label title and legend because we are using we are play plotting a pre major functions so for that ...
234 views
10 views
In this guide, we will explore how to visualize a NxM matrix from sensor data in MATLAB, creating a colorful 2D plot to effectively ...
7 months ago
In this MATLAB tutorial, you will learn how to create 2D subplots to visualize multiple plots in a single figure. Subplots are a ...
109 views
In this session of the MATLAB tutorial series, we explore the plot command, one of the most essential tools for creating 2D plots.
15 views
4 months ago
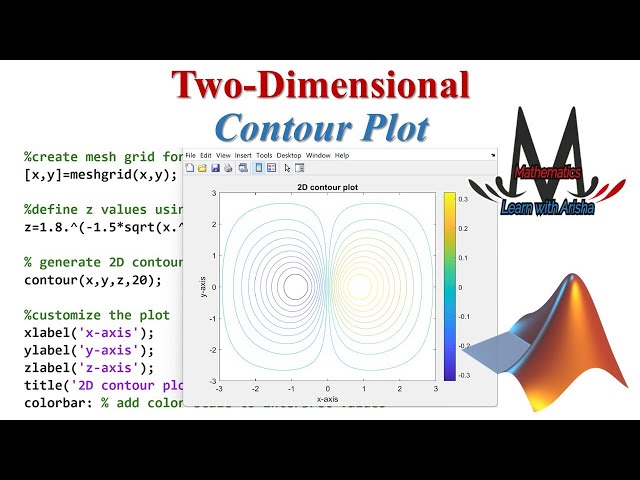
Learn how to create a 2D Contour Plot in MATLAB with this beginner-friendly tutorial! In this video, we guide you through each ...
287 views
In this MATLAB tutorial, you will learn how to create 2D horizontal subplots to display multiple plots in one figure. Horizontal ...
38 views
Learn the difference between hold on and hold off in MATLAB plotting! In this video, I'll show you how to overlay multiple plots ...
284 views
5 months ago
Creating a 3D surface plot in MATLAB is simple and useful for data visualization. #matlab #script In this example, I used the ...
888 views
Kun Yang Coastal Engineer @ Stantec PhD in Coastal Engineering from the Univeristy of Florida. Thanks for Watching!
43 views
Learn how to create a simple 2D plot of the line y = x using MATLAB's versatile plotting functions. --- Disclaimer/Disclosure: Some ...
11 months ago
In this MATLAB tutorial, learn how to create a 2D polar plot using a real-world signal strength pattern example, often used in ...
226 views