Upload date
All time
Last hour
Today
This week
This month
This year
Type
All
Video
Channel
Playlist
Movie
Duration
Short (< 4 minutes)
Medium (4-20 minutes)
Long (> 20 minutes)
Sort by
Relevance
Rating
View count
Features
HD
Subtitles/CC
Creative Commons
3D
Live
4K
360°
VR180
HDR
724 results
How to make animated plot (animated chart) with Matplotlib and Python programming Language. In this tutorial, an animated plot ...
24,740 views
4 years ago
A behind-the-scenes look at how I animate videos. Code for all the videos: https://github.com/3b1b/videos Manim: ...
2,711,332 views
1 year ago
To try everything Brilliant has to offer—free—for a full 30 days, visit https://brilliant.org/ArtemKirsanov/ The first 200 of you will get ...
896,169 views
2 years ago
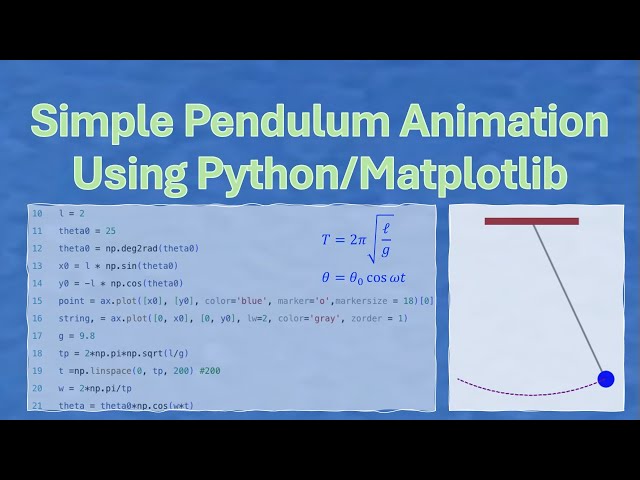
In this video, you will learn how to write a python program to do the animation of a simple pendulum. Step by step instructions are ...
6 views
1 day ago
A bar chart race, also known as a bar chart animation or a bar chart race animation, is a data visualization technique that shows ...
6,144 views
In this video Rob, a Kaggle Grandmaster, quickly and humorously walks through each of the popular plotting and data ...
108,412 views
Source code: https://gist.github.com/syphh/9fa861563977e2cbbf4ddea518677b0a Learn graph theory algorithms: ...
1,218 views
3 years ago
In the field of astronomy and astrophysics, data cubes are fundamental tools for analyzing three-dimensional data sets that ...
255 views
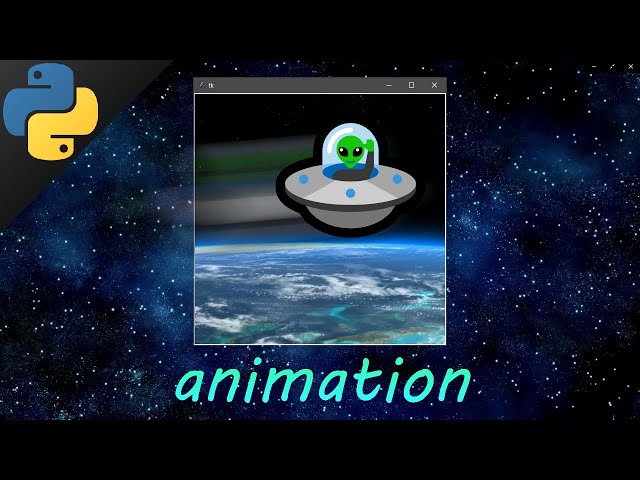
Python tkinter animation animate multiple objects tutorial for beginners #Python #tkinter #animation #animate #multiple #objects ...
42,869 views
5 years ago
A data cube in astronomy is a three-dimensional array of data, where two of the dimensions correspond to spatial information (like ...
388 views
Review code better and faster with my 3-Factor Framework: https://arjan.codes/diagnosis. In this video, I'll share 15 Python ...
453,759 views
Speaker: Reshama Shaikh Plotly is a versatile, open-source python graphing library which lets us make interactive graphs.
104 views
In this video, we are going to learn about how to create a responsive bar chart animations in 3 lines of code using our favourite ...
727 views
This program simulates inertia and surface tension. I made this program in the early 2000s, it was a java applet. I made this ...
58 views
Most of us have heard the saying, "A picture is worth a thousand words," but a movie builds context and a story, especially when ...
1,286 views
This video is part of an online course, Interactive 3D Graphics. Check out the course here: https://www.udacity.com/course/cs291.
299 views
10 years ago
Go experience the explorable videos: https://eater.net/quaternions Ben Eater's channel: https://www.youtube.com/user/eaterbc ...
1,449,341 views
7 years ago
In the ever-evolving world of data visualization, scatterplot animation has emerged as a captivating and powerful tool to breathe ...
175 views
Python tkinter animation animations canvas tkinter GUI tutorial #Python #tkinter #animation #animations #canvas #GUI #tutorial.
58,343 views