Upload date
All time
Last hour
Today
This week
This month
This year
Type
All
Video
Channel
Playlist
Movie
Duration
Short (< 4 minutes)
Medium (4-20 minutes)
Long (> 20 minutes)
Sort by
Relevance
Rating
View count
Features
HD
Subtitles/CC
Creative Commons
3D
Live
4K
360°
VR180
HDR
156,468 results
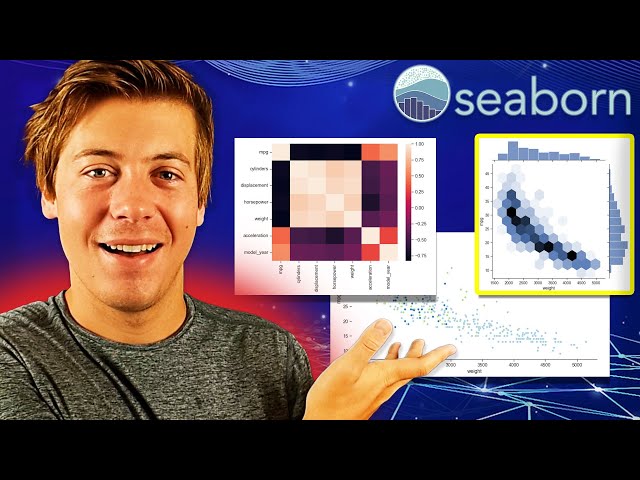
This video is about Seaborn, an external Python data visualization library, which is based on Matplotlib.
223,120 views
3 years ago
This Seaborn Full Course by Intellipaat is your one-stop guide to mastering data visualization in Python using Seaborn. Perfect for ...
44,361 views
6 months ago
This video today is a crash course on Seaborn, a data visualization library for Python built on top of Matplotlib. It makes it super ...
5,201 views
12 days ago
New Data Science / Machine Learning Video Everyday at 1 PM EST!!! [ Click Notification Bell ] This video provides complete ...
256,250 views
5 years ago
See how Python is transforming Excel into a data powerhouse. In this video, we'll demonstrate: • The groundbreaking PY function ...
5,335 views
8 months ago
Python #Regression #NumPy https://alphabench.com/data/python-linear-regression.html ✓ Please SUBSCRIBE: ...
77,698 views
4 years ago
An introduction to the Dash web application framework. Dash is used to create browser-based interactive data visualization ...
854,840 views
The Seaborn heatmap is a simple visual that allows you to display tables of data through color. This Seaborn heatmap tutorial ...
72,675 views
This Seaborn histogram video shows you how to make a histogram in Python using the Seaborn histplot. I begin by showing you ...
35,403 views
Today we learn how to create professional interactive web visualizations with Bokeh in Python.
42,942 views
Seaborn es el módulo de Python para la visualización de datos, y puedes ver la relación que hay entre las diferentes variables de ...
21,247 views
8 years ago
In this video we do a complete Matplotlib crash course in Python. FormulaStudio: https://www.formulastudio.xyz/ ...
279,957 views
2 years ago
In this video we take a quick look at the Plotly framework in Python. At the end we compare it to Matplotlib.
105,143 views
Learn about coding the Seaborn bar plot in this tutorial video. I demonstrate how to make a barplot with seaborn and how to make ...
29,886 views
In this video, we dive deep into the world of data visualization in Python using three powerful libraries: Matplotlib, Seaborn, and ...
2,214 views
1 year ago
Curso Estadística Descriptiva: https://codificandobits.com/curso/estadistica-descriptiva/ Asesorías y formación ...
2,450 views
5 months ago
If you work with data in Python, at some point you'll need to visualize it. In this video, I'll show you the differences ...
1,643 views
9 months ago
Don't miss out! Get FREE access to my Skool community — packed with resources, tools, and support to help you with Data, ...
7,946 views
"️️ Professional Certificate in AI and Machine Learning, delivered by Simplilearn in collaboration with Purdue University ...
53,013 views
Para citar este recurso educativo utiliza la siguiente referencia: Gutiérrez-García, J.O. [Código Máquina]. (2022, 1° de Agosto).
12,125 views
This first video of my "Introduction to Seaborn" series covers the basics of seaborn, a Python library for data visualization. Here ...
79,596 views
Python Certification Training: https://www.edureka.co/data-science-python-certification-course ** This Edureka video on 'Python ...
132,240 views
Streamed 6 years ago
In this video Rob, a Kaggle Grandmaster, quickly and humorously walks through each of the popular plotting and data ...
108,765 views