Upload date
All time
Last hour
Today
This week
This month
This year
Type
All
Video
Channel
Playlist
Movie
Duration
Short (< 4 minutes)
Medium (4-20 minutes)
Long (> 20 minutes)
Sort by
Relevance
Rating
View count
Features
HD
Subtitles/CC
Creative Commons
3D
Live
4K
360°
VR180
HDR
761 results
A behind-the-scenes look at how I animate videos. Code for all the videos: https://github.com/3b1b/videos Manim: ...
2,833,820 views
1 year ago
To try everything Brilliant has to offer—free—for a full 30 days, visit https://brilliant.org/ArtemKirsanov/ The first 200 of you will get ...
901,544 views
2 years ago
To learn for free on Brilliant, go to https://brilliant.org/techwithtim . Brilliant's also given our viewers 20% off an annual Premium ...
10,505 views
3 weeks ago
How to make animated plot (animated chart) with Matplotlib and Python programming Language. In this tutorial, an animated plot ...
24,808 views
4 years ago
A bar chart race, also known as a bar chart animation or a bar chart race animation, is a data visualization technique that shows ...
6,229 views
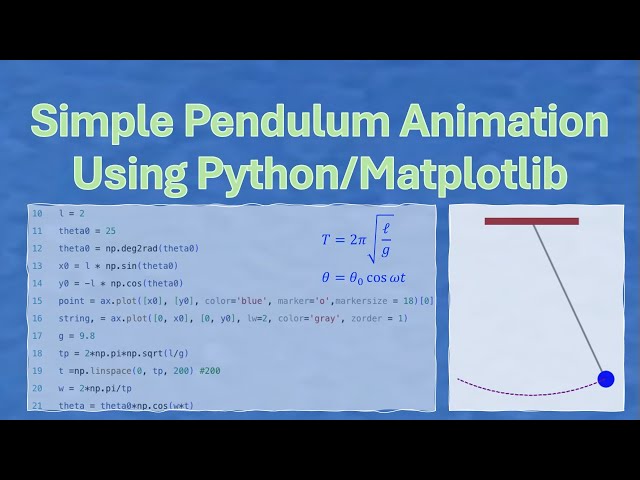
In this video, you will learn how to write a python program to do the animation of a simple pendulum. Step by step instructions are ...
21 views
1 month ago
In this video Rob, a Kaggle Grandmaster, quickly and humorously walks through each of the popular plotting and data ...
109,726 views
This program simulates inertia and surface tension. I made this program in the early 2000s, it was a java applet. I made this ...
58 views
Source code: https://gist.github.com/syphh/9fa861563977e2cbbf4ddea518677b0a Learn graph theory algorithms: ...
1,221 views
Let's try to convince a bunch of particles to behave (at least somewhat) like water. Written in C# and HLSL, and running inside the ...
2,472,301 views
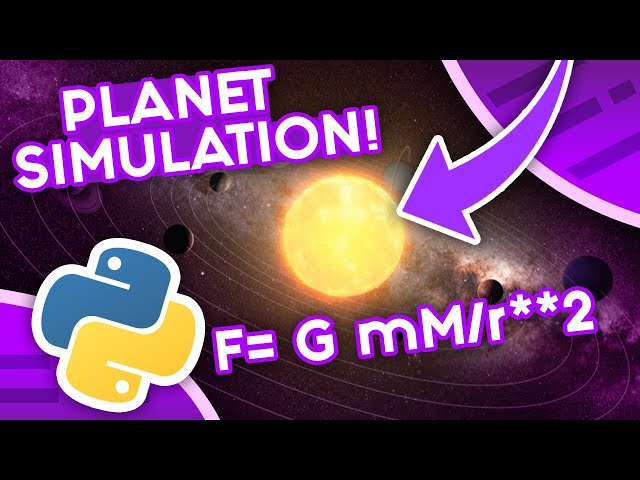
Welcome back to another tutorial video! In this video I am going to be showing you how to make a planet simulation using Python!
536,485 views
In the ever-evolving world of data visualization, scatterplot animation has emerged as a captivating and powerful tool to breathe ...
180 views
In the field of astronomy and astrophysics, data cubes are fundamental tools for analyzing three-dimensional data sets that ...
260 views
In this simple demo, I have used Matplotlib to create a mp4 file which shows how gradient descent is used to come up with the ...
3,068 views
6 years ago
GoPro #Python #metadata 日本語版はコチラ: https://youtu.be/Ebd_GTNwWac My previous Youtube video about the effects of the ...
200 views
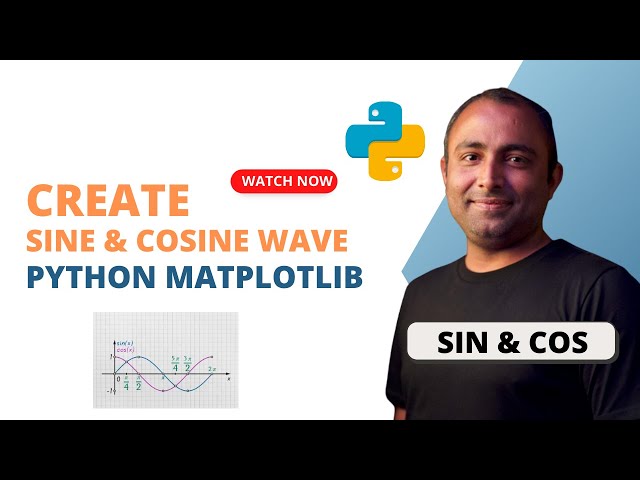
In this video, we will visualize the sine and cosine waves using Python's Matplotlib library. The video showcases a dynamic ...
838 views
We have prepared a video tutorial about Matplotlib, which is a plotting library for the Python programming language and ...
661 views
In this video, we are going to learn about how to create a responsive bar chart animations in 3 lines of code using our favourite ...
727 views
5 years ago
Speaker: Reshama Shaikh Plotly is a versatile, open-source python graphing library which lets us make interactive graphs.
107 views
What pitch classes are playing? We computed a chromagram, ie. a sequence of pitch class vectors in time using the Python tfr ...
331 views
9 years ago