Upload date
All time
Last hour
Today
This week
This month
This year
Type
All
Video
Channel
Playlist
Movie
Duration
Short (< 4 minutes)
Medium (4-20 minutes)
Long (> 20 minutes)
Sort by
Relevance
Rating
View count
Features
HD
Subtitles/CC
Creative Commons
3D
Live
4K
360°
VR180
HDR
27,225 results
Example of an animation with various subplots and axes using Python and Matplotlib.
21,717 views
13y ago
Take my Full Python Course Here: https://www.analystbuilder.com/courses/pandas-for-data-analysis In this series we will be ...
124,624 views
3y ago
In this video we learn about centrality algorithms, which are one of the traditional categories of graph algorithms. You can read ...
7,068 views
5y ago
Strengthen your skills in algorithmics and graph theory, and gain experience in programming in Python along the way. To follow ...
2,679 views
7y ago
3,659 views
8,205 views
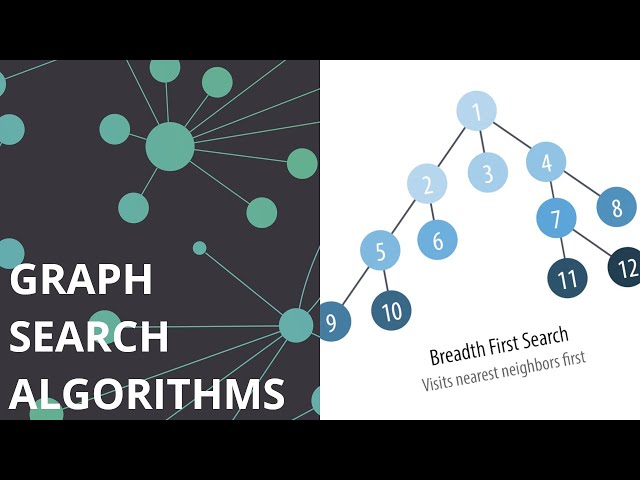
In this video we learn about graph search algorithms, which are one of the fundamental building blocks of graph algorithms.
6,167 views
8,406 views
2,737 views
3,290 views
Realtime Plotting with Python and pylab/matplotlib More info and source code at: ...
30,484 views
14y ago
1,974 views
Graphs with networkx Python networkx library A simple undirected graph (or simply, a graph) G is defined as G=(V,E) , where ...
1,770 views
4y ago
In this video, I am using https://infranodus.com to generate a knowledge graph using LLM. I will show you how you can build a ...
12,735 views
1y ago
3,745 views
3,198 views
"Graph Databases: Talking about your Data Relationships with Python [EuroPython 2017 - Talk - 2017-07-14 - PyCharm Room] ...
901 views
8y ago
Aileen Nielsen https://2016.pygotham.org/talks/368/probabilistic-graphical-models-in-python This talk will give a high level ...
33,471 views
9y ago
Graphillion is a Python module to efficiently manipulate a number of, even x-illions of, graphs for heavy graph problems like ...
1,087 views
Streamed 12y ago
1,991 views