Upload date
All time
Last hour
Today
This week
This month
This year
Type
All
Video
Channel
Playlist
Movie
Duration
Short (< 4 minutes)
Medium (4-20 minutes)
Long (> 20 minutes)
Sort by
Relevance
Rating
View count
Features
HD
Subtitles/CC
Creative Commons
3D
Live
4K
360°
VR180
HDR
99,579 results
In this video we take a look at the best resources to learn Data Visualization in 2025! 25% off Analyst Builder Code: ...
17,789 views
1y ago
Video Description: Master Data Visualization with Python: From Beginner to Advanced! In this comprehensive Data ...
47,139 views
... Data Analysis Specialization - https://coursera.pxf.io/AoYOdR Tableau Data Visualization - https://coursera.pxf.io/MXYqaN ...
131,533 views
3y ago
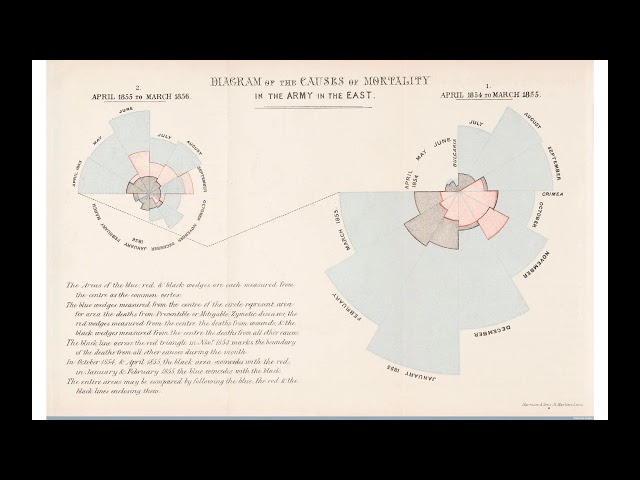
This IASSIST Professional Development Webinar was originally broadcast on April 29, 2019. It provides an overview of ...
582 views
7y ago
Pat introduces the DAIJ model for giving a critique to a data visualization that is often used to critique art. By describing, analyzing ...
820 views
249,994 views
4y ago
Overview of the course found here: https://curran.github.io/dataviz-course-2018/
15,361 views
8y ago
Presented by David Christensen. This video is part of a series of lectures recorded to teach about basic data visualization ...
344 views
Hello everyone! In todays video I want to show you how you can use Obsidian for data visualization by using Obsidian Charts, ...
31,221 views
2y ago
Check out all my Full Courses on Analyst Builder: https://www.analystbuilder.com/ 25% Off Analyst Builder Code: BOOTCAMP In ...
1,066,709 views
5mo ago
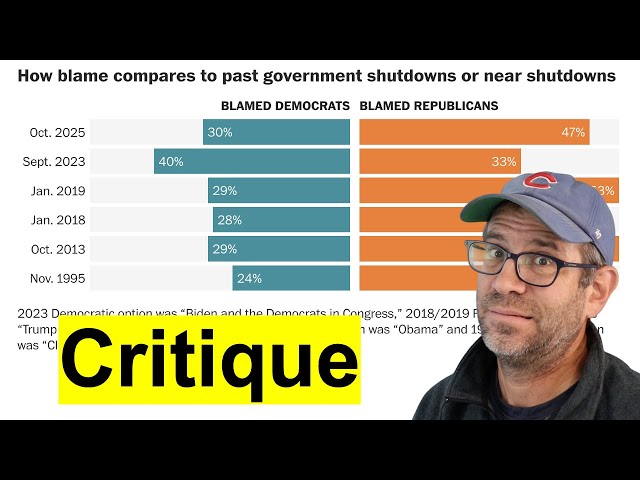
Whenever we see or generate a data visualization it's important that we review what does and doesn't work in the visual. In this ...
1,968 views
5y ago
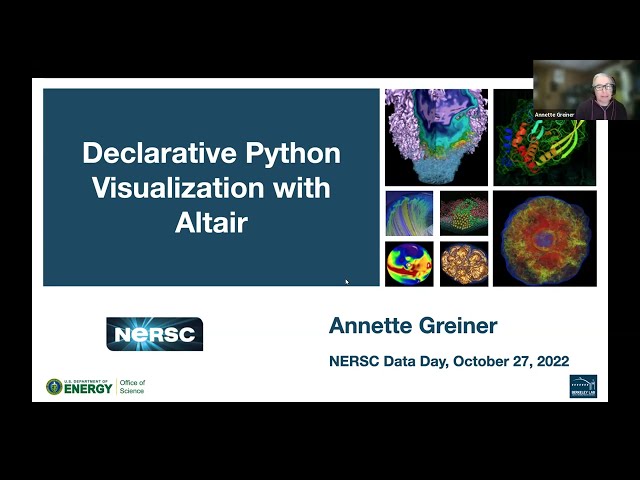
Part of the Data Day 2022 October 26-27, 2022 Please see https://www.nersc.gov/users/training/data-day/data-day-2022/ for the ...
501 views
Learn how to craft effective data visualizations. Part of https://curran.github.io/dataviz-course-2018/
8,008 views
This video explains how to visualize data in R using the ggplot2 package. Specifically, I show how to make a boxplot and a ...
265 views
6y ago
Learn about the Data Science Pipeline with the National Student Data Corps! The fifth step in the Data Science Pipeline is Data ...
Presented by Alisa Rod. This video is part of a series of lectures recorded to teach about basic data visualization concepts.
402 views
3,803 views
Data Science Mentorship Program (DSMP) 2022-23 Enroll in this Programme from our Website - https://learnwith.campusx.in/ ...
169,035 views
Streamed 3y ago
Short tutorial on how to set up a basic data visualization in Microsoft's Power BI.
13,125 views
9y ago
An introduction to Data Visualization. An insight into Data Visualization Concepts, Display Media, Dashboards and Design ...
116 views